Testing…testing…one…two…twelve
Amy would normally test her blood sugars a minimum of four times a day, often 6 and sometimes 10. For the first 24 hours of having a pump she did a minimum of 12, one every two hours.
For those of you who don’t have diabetes – or friends with – let me just say that: yes, testing hurts a bit; no, it doesn’t get easier the more you do; no, you don’t get ‘used to it’; yes, it makes your fingers sore.
It’s not all about the data
Accumulating masses of data is a by product of having type 1 diabetes. It’s hard to ignore the numbers when you’ve been testing your blood sugar, counting the carbohydrates you’re consuming, giving doses of insulin, giving correction doses of insulin, feeding yourself glucose to raise your blood sugar.
Analysing this data can help you and your DSN realise what slight changes need to be made to help achieve seemingly impossible stable blood sugars between the levels of 4mmol and 8mmol.
Amy’s blood glucose data from before the pump
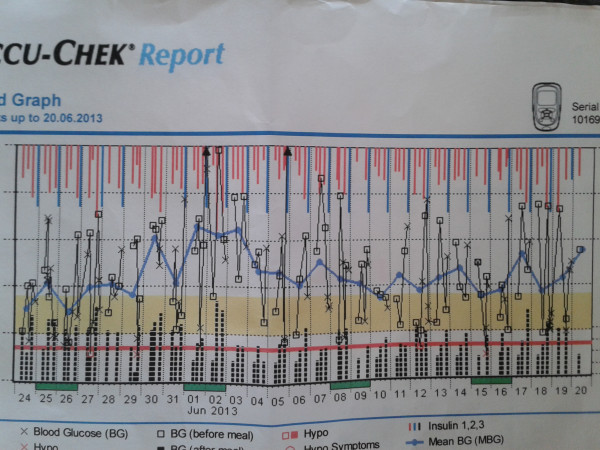
Below is a graph of Amy’s blood glucose from before the pump.
Whilst it look pretty darn complicated the key things to notice are:
– the the yellow bar shows our meters ideals level of between 5mmol and 8mmol. (Amy doesn’t like hypos hence the 5mmol rather the desired 4mmol.)
– the blue line which is an average of the readings, noting that many of the readings hit 15mmol and 20mmol.
– the average is consistently above the desired zone.
Just for information, no analysis
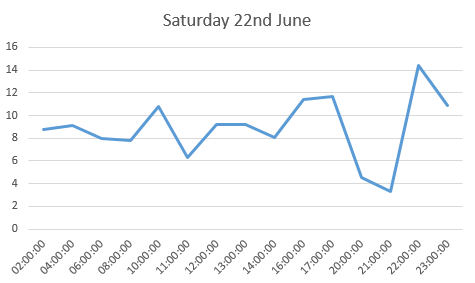
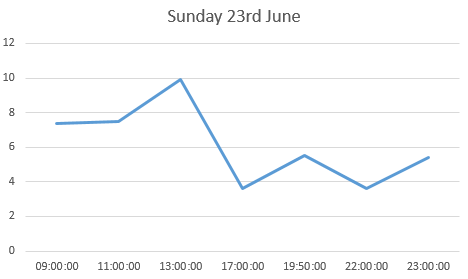
I haven’t analysed the following data and I won’t be making any changes but it’s interesting to see how quickly the pump is helping with BG control. Before she went on the pump she was constantly quite high and to be honest we did nothing about it as we new the pump was coming along soon. As Amy hated injections so much we rarely “corrected” any high blood glucose readings, this being a reason we really wanted a pump.
Here then are the graphs for the different days
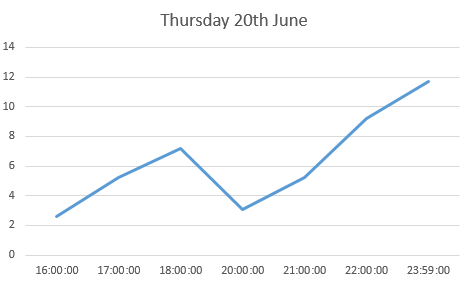
Thursday 20th June – pump day
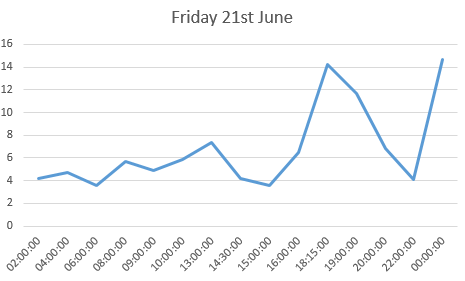
Friday 21st June – a day of overeating
Saturday 22nd June – a relaxing morning, a busy afternoon/evening
Sunday 23rd June – …and relax
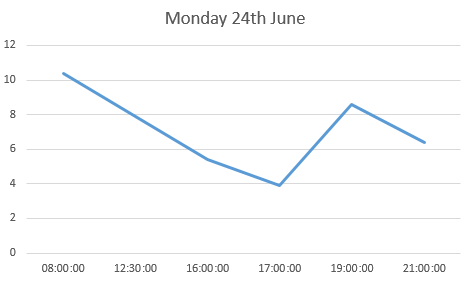
Monday 24th June – first day back at school
