
 A few weeks ago on the 18th June Amy inserted her first CGM sensor. On the 12th July she took it off.
It lasted 25 days.
Initially it was very exciting seeing how accurate Dexcom was in comparison to Amy’s normal finger-stick checks, seeing those graphs, flipping between 1 hour graphs, 3 hours, 6, 12, 24.
Then it felt scary: how high she had gone after a meal, how high during the night, the fast dropping blood glucose levels, the lows after school.
Then it felt like we could put this information to use and start to alter Amy’s basal/background insulin levels. That is after all one of the key reasons we got it.
A screen full of information
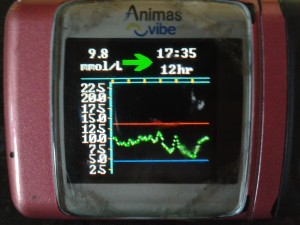
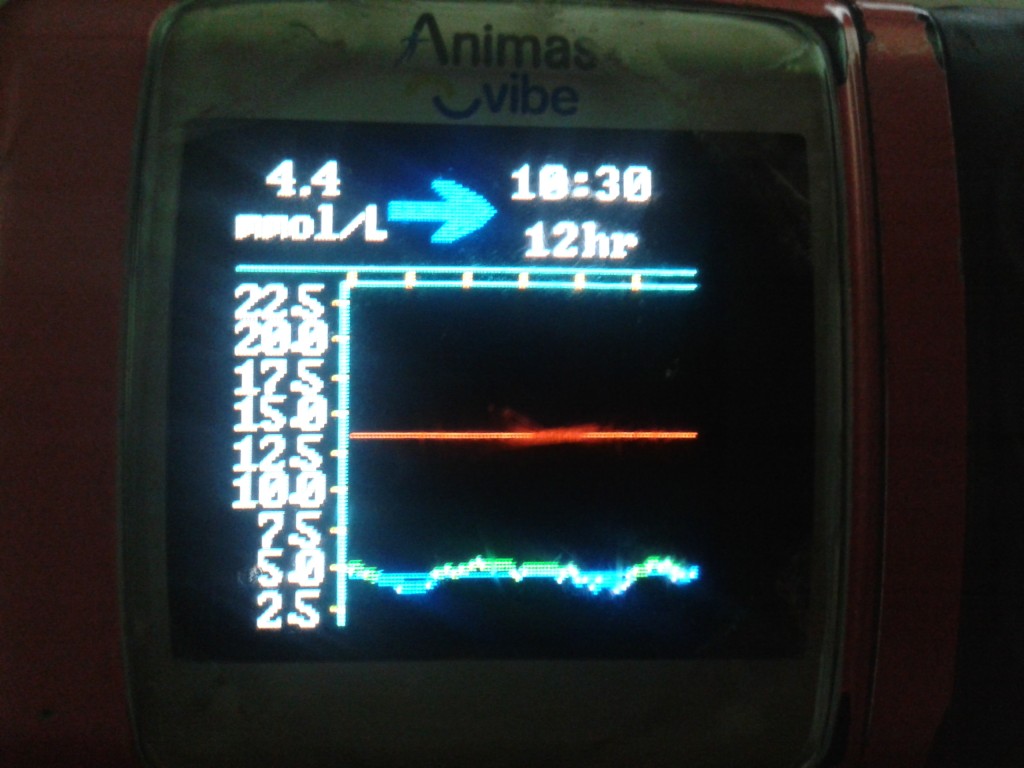
The screen shows a lot of information:
The red line is the level where Amy will get alerted that she’s ‘high’, we’ve set it at 13.3mmol/L.
The blue line is the level where Amy will get alerts that she’s ‘low’, we’ve set it at 4.4mmol/L.
The dotted green line is her CGM trace which believe me doesn’t often look that flat, it’s more like a section of the alps or England’s rolling hills.
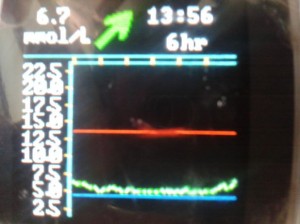
So in the blink of an eye you can see it’s 13:56 and Amy is currently 6.7mmol/L and rising, steadily, because at 1pm (one yellow mark from the right) having slept in really (really) late she woke up and had lunch 30 minutes later.
An opportunity for experimenting and learning
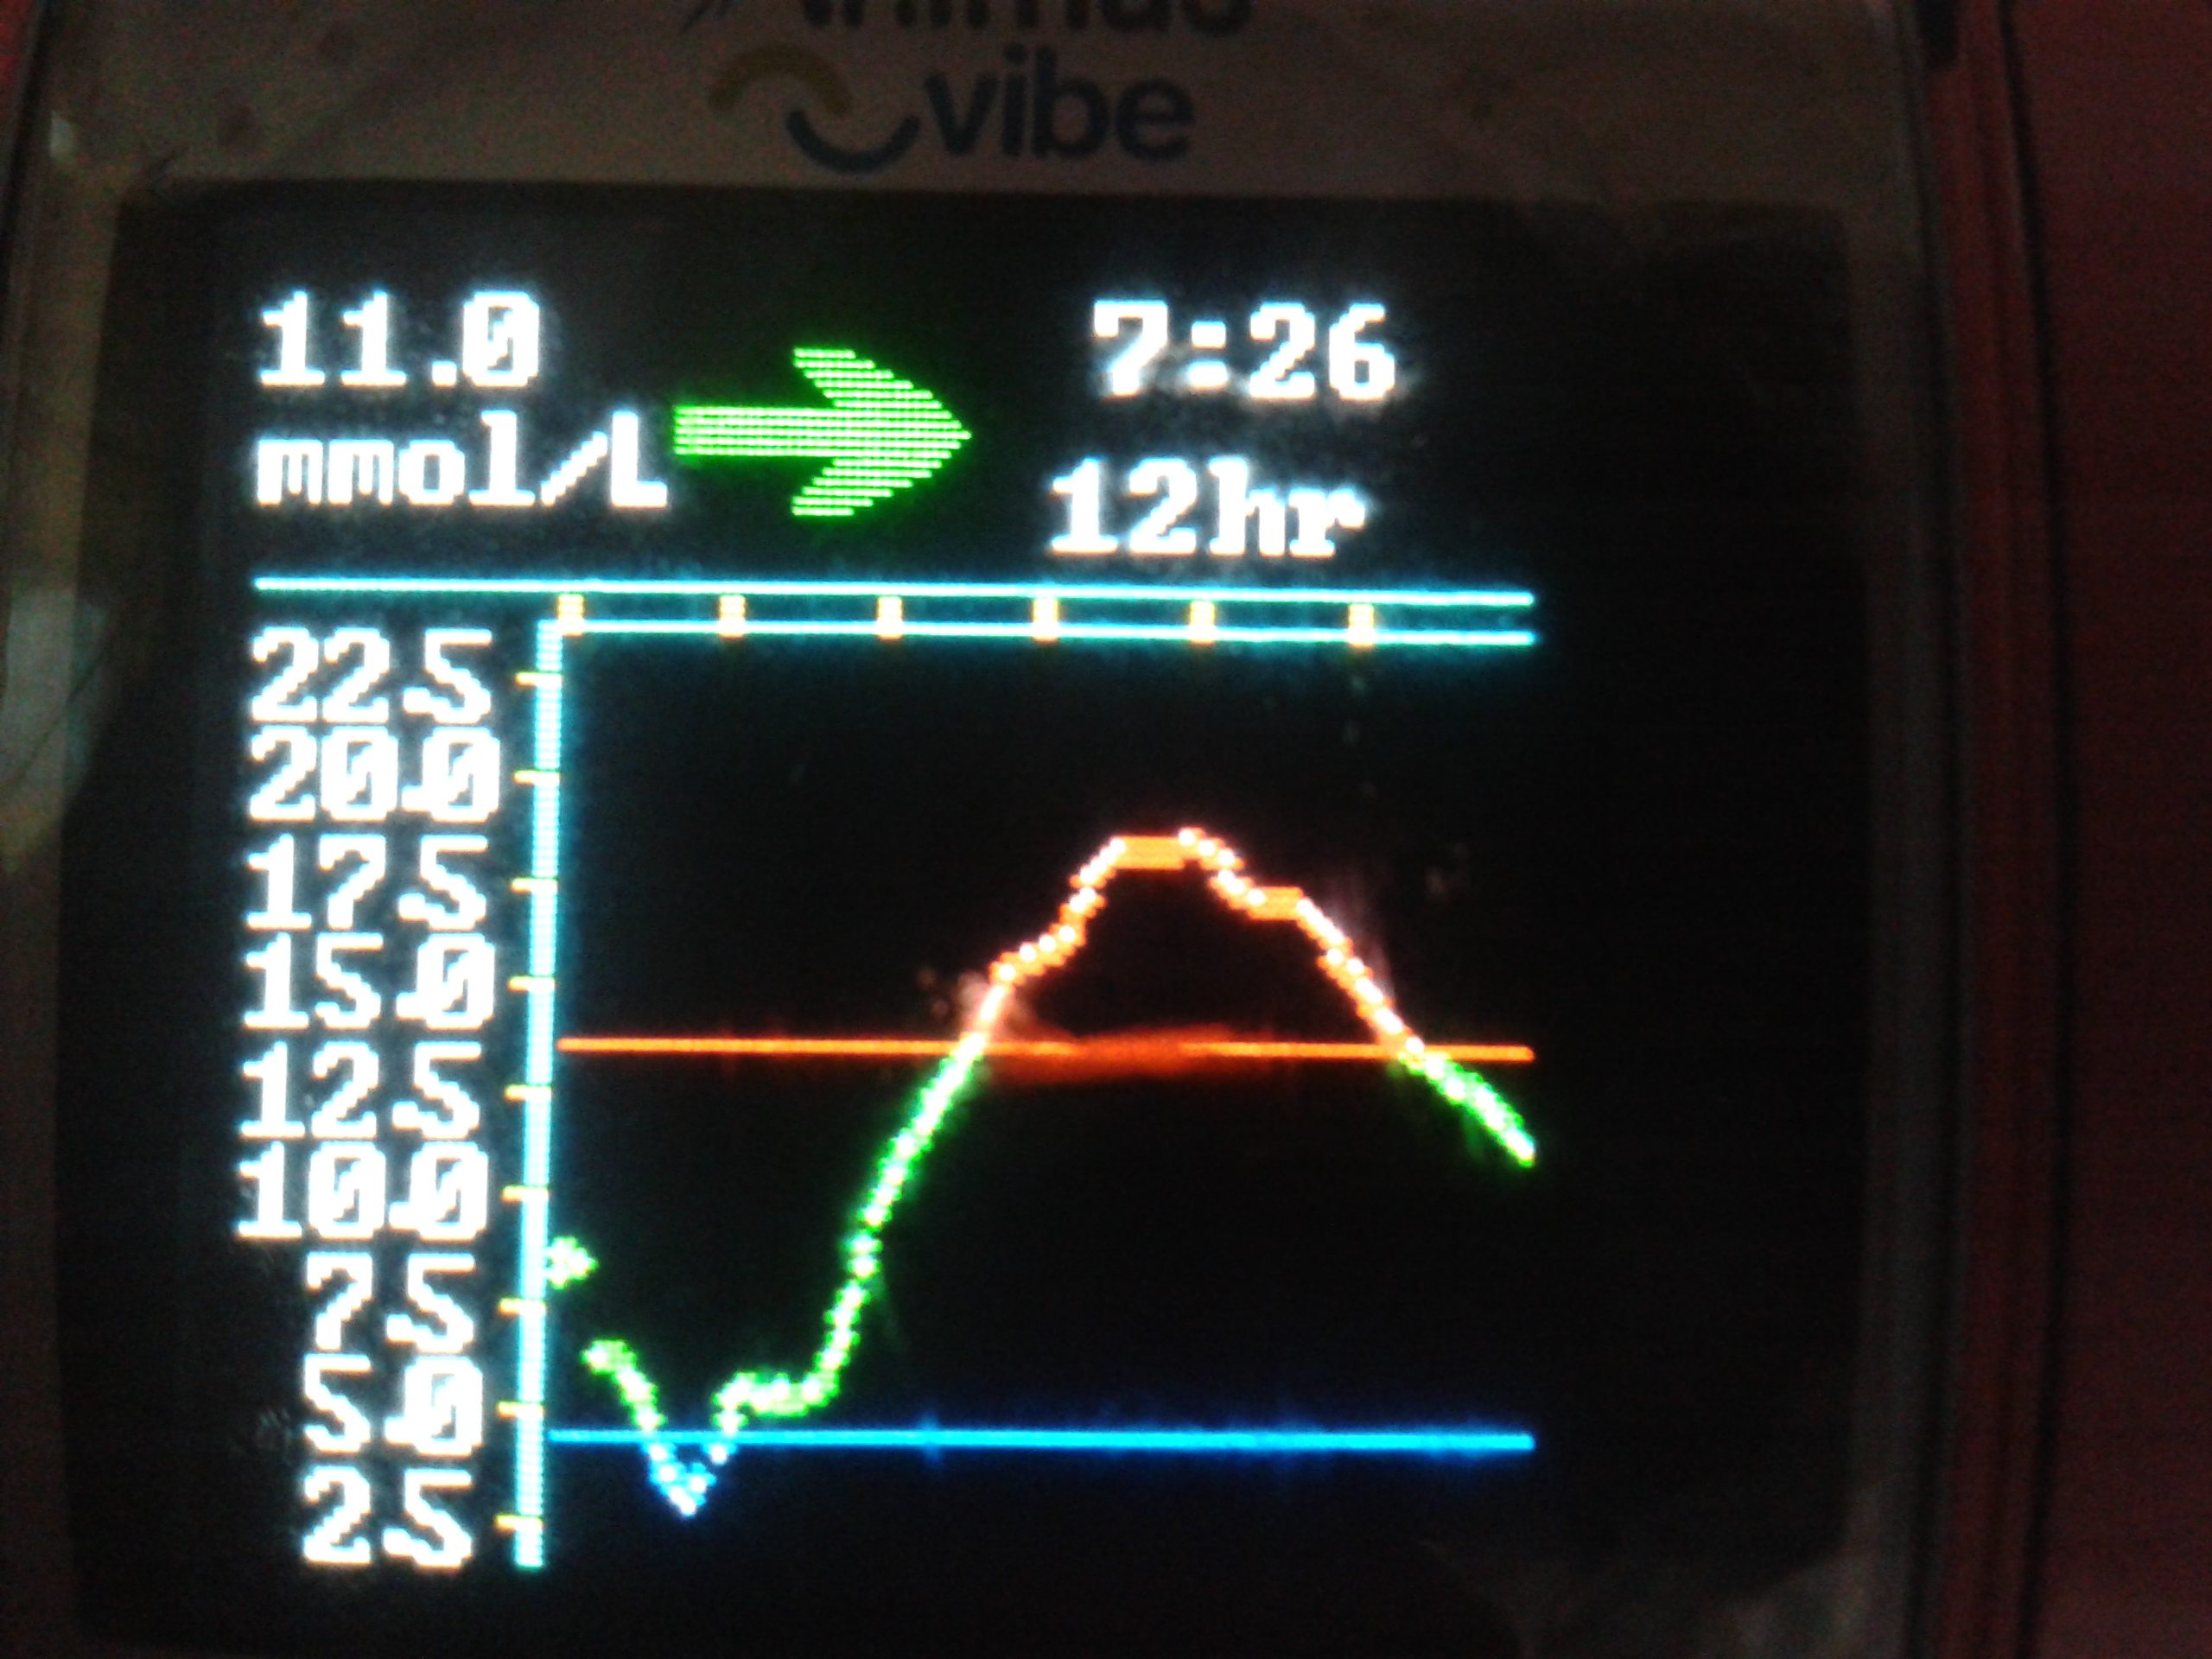 Combo bolus (60/40/2.5hrs) for Rice/Curry
Some graphs don’t initially look very good at all, but they are as they’re always opportunities for learning. Take the one on the right, it’s a graph of us experimenting with eating a Chicken Xacuti curry and rice and giving a combo-bolus on the pump of 60% of the insulin immediately and the remaining 40% over 2.5 hours. It tells us a lot…don’t eat rice (joke).
From the graph we can tell that need to give less insulin up front so we’ll probably try a 40%/60% next time. We know this because she started at 6.5mmol/L and dropped to 3mmol/L(ish) within the first 90 minutes.
Analysing the averages
Unfortunately the previous graph isn’t too much use because at that time Amy’s basal/background insulin was wrong and her levels were high from 10pm until about 4am.
How do we know? We uploaded the CGM data to Diasend and analysed it, although at first it didn’t make us feel very good to see what was really going on:
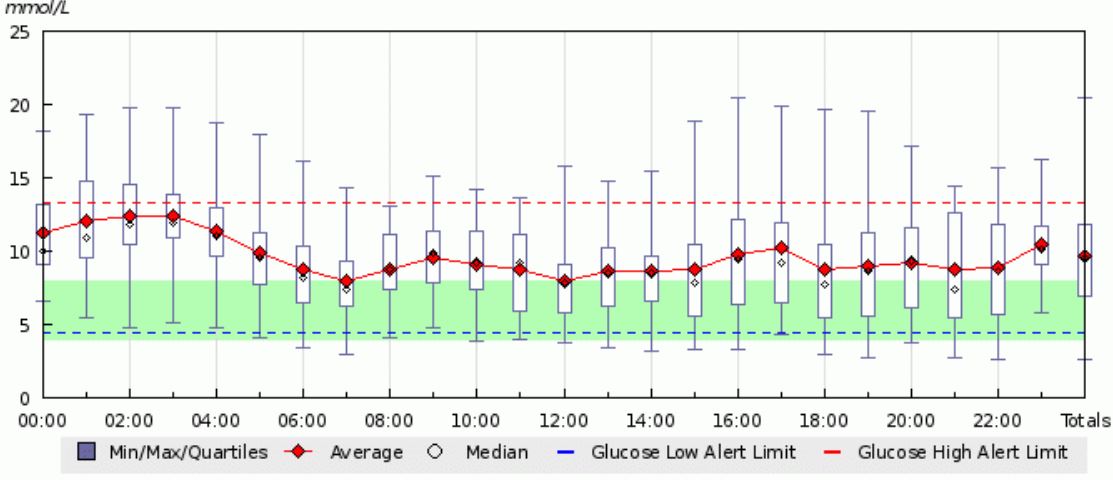
That looks all very confusing but the two key things look at are the green bar (which is the magic zone of between 4mmol/L and 8mmol/L) and the red line which shows the average blood glucose levels for each particular time of the day.
It tell us we have a problem: she’s rarely in that magic range, her average is too high, she needs more basal/background insulin.
The foundations need some work
Deciding to focus on the night time of 10pm to 8am we didn’t do any changes to her basal profile for two weeks as we wanted to discuss the CGM results with the nurse at clinic. We all agreed on the changes required and then watched the next few nights’ graphs, making some tweaks here and there, before finally getting the graph below, although we’ll make sure she’s a little higher when she goes to bed from now on.
My 11 year old son Luke also had a cgm 4 weeks ago and it lasted 3 weeks. When he took it off, I felt lost without it! Only 1 thing that needs improving – the alarm is too quiet. It certainly would never wake Luke and it is too quiet to even wake me! I still set my alarm to check his glucose levels during the night, although at least now with a cgm, I don’t do a finger prick test, I just look at the screen.
Thanks for this great update Kev. CGM is most definitely one of the ways forward. Dr. Cranstson at QA had me wear a CGM while I was away on our walking / activity week in St Ives in April. It was an eye opening and liberating experience for me. The week was challenging anyway with some very long walks over rough and steep terrain in some pretty hot weather, so having a continuous picture of what my BG levels were doing was invaluable and really helped me dose adjust, correct and take on-board carbs to stop a drop in its tracks. Just like the other person commenting, I felt lost without it after I took it off.