
NOTE: xDrip used to be called DexDrip so you might find some references to the old name in this article.
 A graph from a Nightscout website showing
results from Dexcom and xDrip data
Many people have asked questions about the accuracy of xDrip’s algorithm in comparison to the latest Dexcom G4 algorithm, codenamed 505.
To answer this question for himself Andrew Abramowicz decided to get xDrip and an original Nightscout rig to upload data to the same database at the same time, with both sets of data coming from the same Dexcom G4 sensor/transmitter. This then is a true test of how things worked for Andrew and his family. Thanks Andrew for allowing me to use this these images on this page.
PLEASE READ THIS FIRST
a) before using xDrip for prime time use, run these tests for yourself.
b) if you don’t calibrate properly your results may vary, correct calibration is the key.
c) while these results mimic that of the 505, it is still an “experimental algorithm” and should be used with great caution.
d) as (c)…but to add…’especially in children’.
e) before using xDrip decide for yourself if it is good enough for you based on your own tests
f) we are not “endorsing” it for use by others, just publishing our findings.
NOTE:You can click on most of the images to view the full image in your browser.
A little background bit on the data, which you can probably skip
Andrew’s son wears a Dexcom G4 CGM sensor and transmitter and for a while has used a Nightscout uploader rig to send CGM data to the cloud to be viewed on a Nightscout web site.
Andrew recently built a xDrip device, which can also upload its data to the cloud to be viewed on a Nightscout web site.
The Dexcom G4 receiver (which is part of the uploader rig) and the xDrip both read the same data from the same Dexcom transmitter and sensor.
Both are loading their data up to the same cloud database which is then linked to the same Nightscout web site.
Data from both is overlayed together, allowing for an easy visual comparison and ultimately to see any discrepancies.
What’s all those strange low numbers?
If you’re used to seeing much higher numbers – perhaps you live in the USA? – then don’t panic, the glucose values show are in mmol/l because Andrew is in Canada. To work out a mg/dl value from a mmol/l value just (!) multiply any numbers by 18, so 5mmol/l is 90mg/dl, 10 = 180 etc.
If you’re used to seeing much higher numbers – perhaps you live in the USA? – then don’t panic, the glucose values show are in mmol/l because Andrew is in Canada. To work out a mg/dl value from a mmol/l value just (!) multiply any numbers by 18, so 5mmol/l is 90mg/dl, 10 = 180 etc.
An explanation of a Nightscout website graph
The image below is of Andrew’s Nightscout website. For those who have never seen one before here’s an explanation of what is shown.
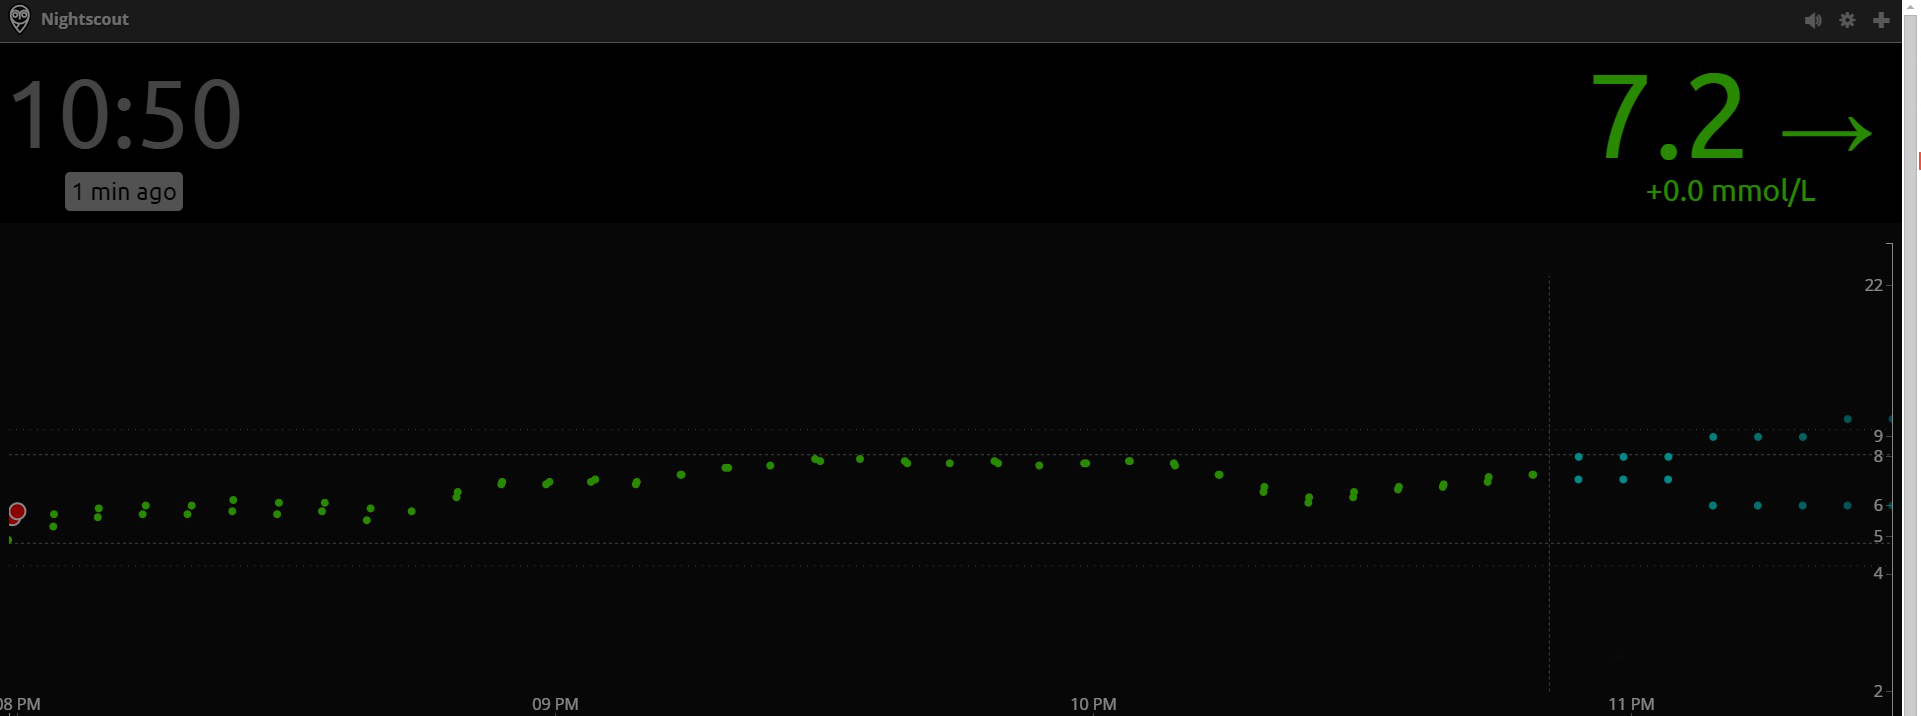
Top left is the time ’10:50′ and showings that the last CGM data received happened 1 minute ago.
Top right is the last CGM reading of 7.2mmol/l (129.6mg/dl) and this has stayed the same from the previous reading.
On the right is the range axis, showing 22mmol/l at the top and 2 at the bottom.
The dots show show the glucose readings, with green dots being actual readings and blue dots being projected readings.
The rightmost green dot is the last reading of 7.2mmol/l from one minute ago.
The rightmost green dot is actually two dots, one for Dexcom, one for xDrip but they are both the same value.
The first reading shown on the left shows that there was a difference between Dexcom and xDrip of approximately 0.4mmol/l (7mg/dl).
The two red dots on the left are where a calibration has taken place, one for Dexcom, one for xDrip.
More explanations
Here’s a visual explanation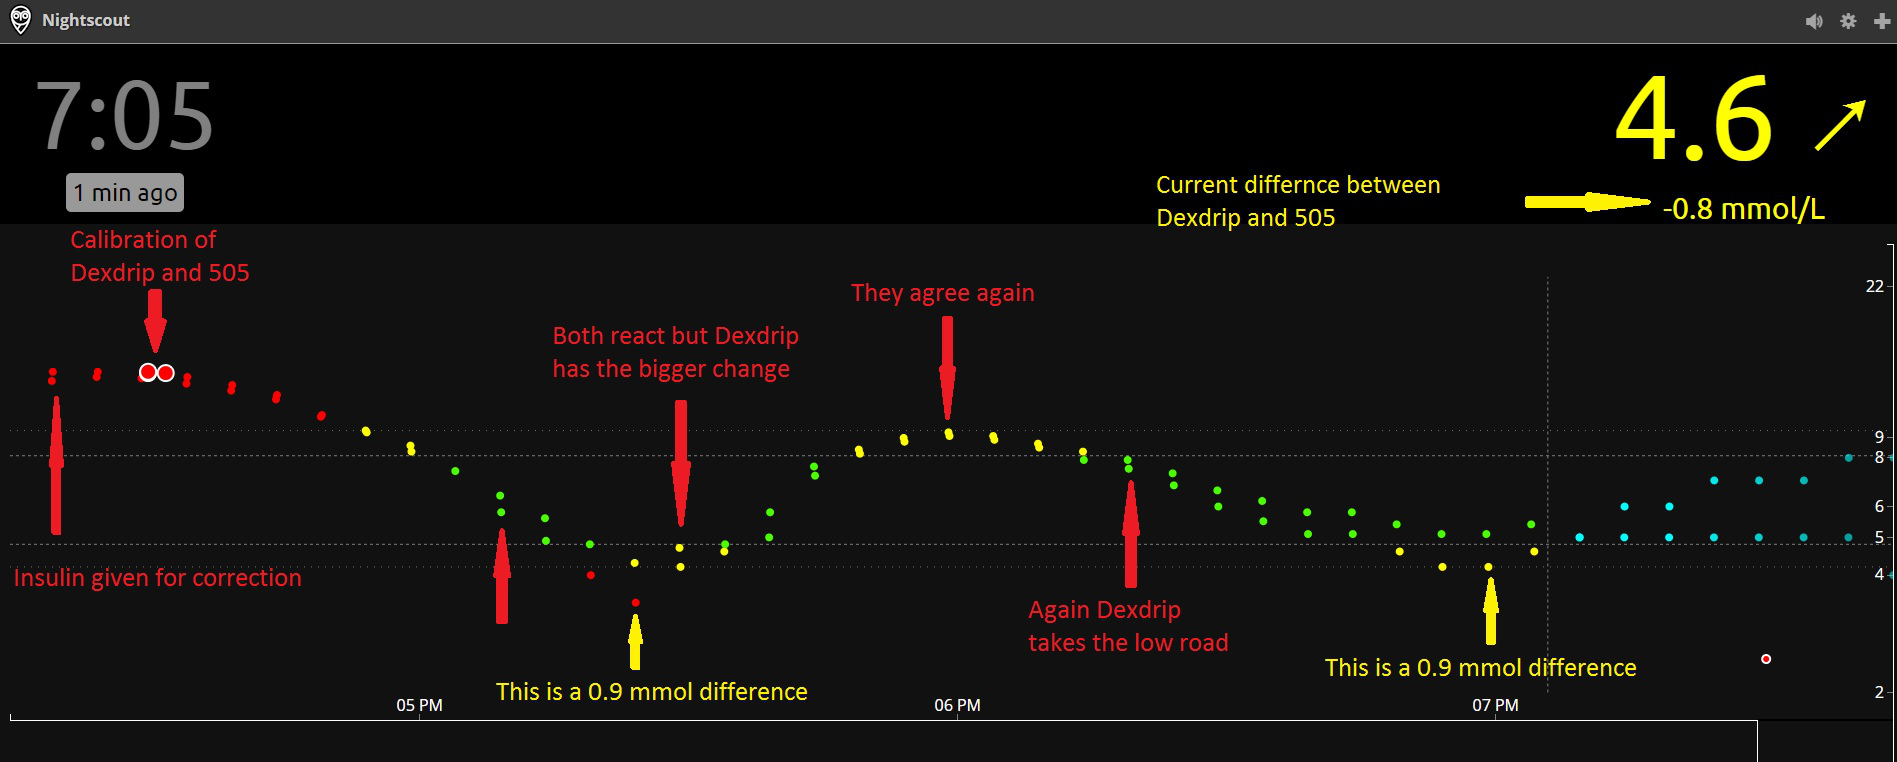
Here’s a visual explanation
Comparison overview
Here’s an image showing how close xDrip and Dexcom are for the majority of the time.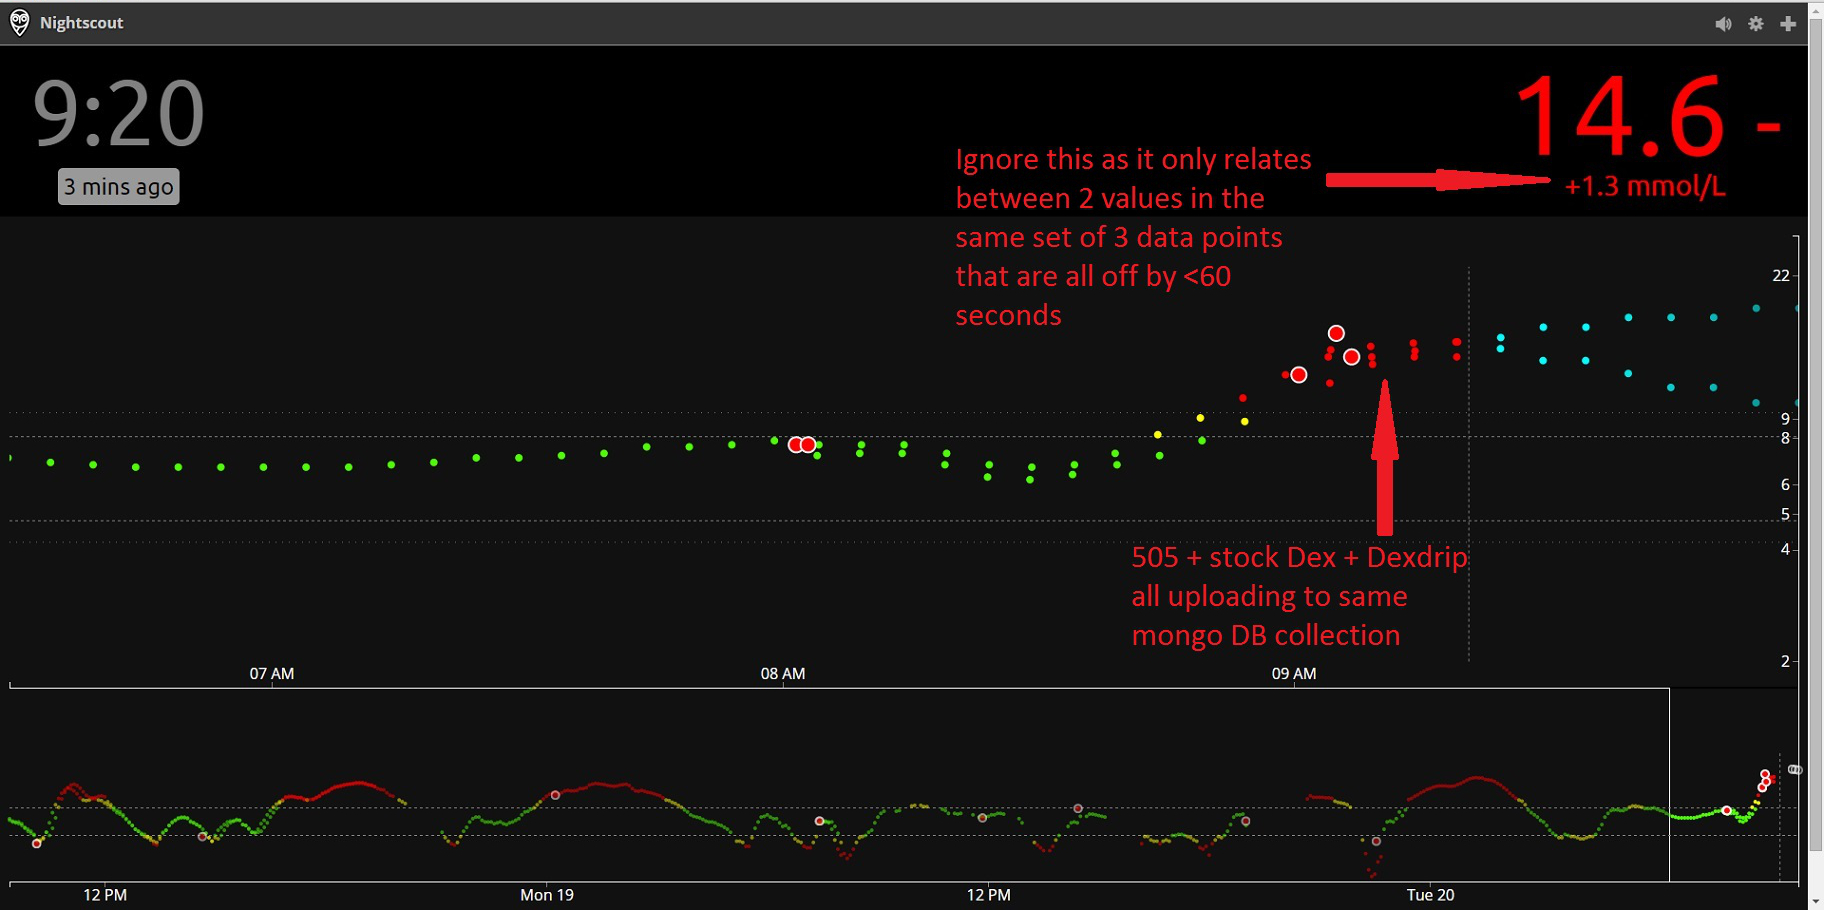
Here’s an image showing how close xDrip and Dexcom are for the majority of the time.
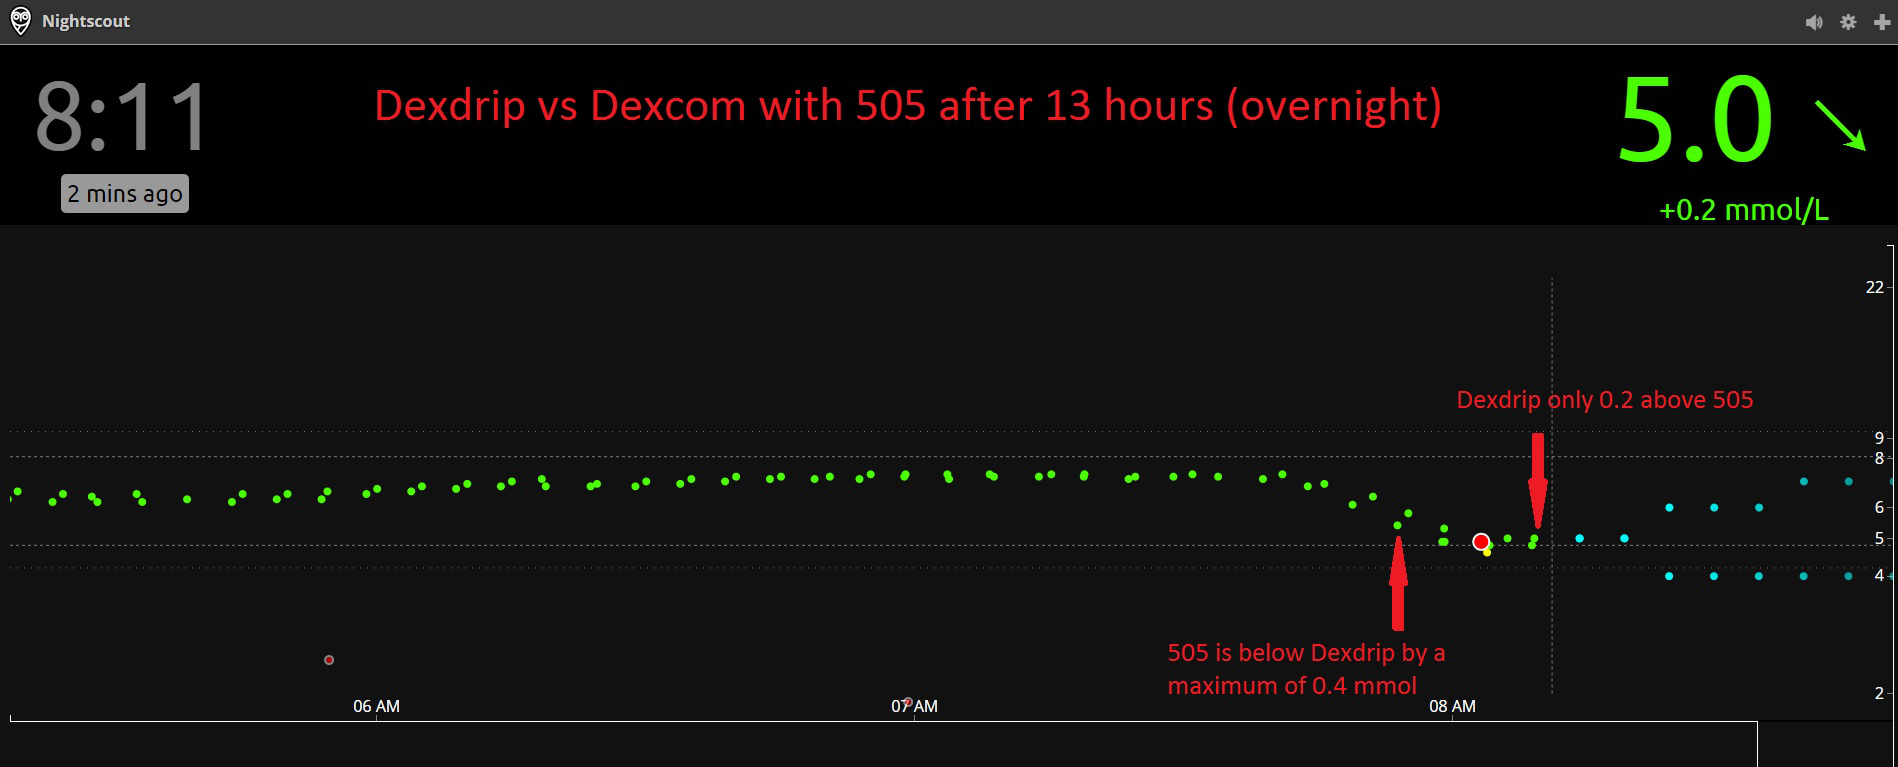
An overnight test
The next image is of an overnight test showing a hypo in the middle. During the hypo the variance was the largest Andrew has ever seen, before the correction with glucose it looks to me to be about 0.4 mmol/l out, straight after the correction either Dexcom or xDrip appears to have gone wildly out for one reading.
However, no-one I know would rely on CGM data anytime near a hypo situation and never should any treatment been done with first taking a finger prick blood glucose test.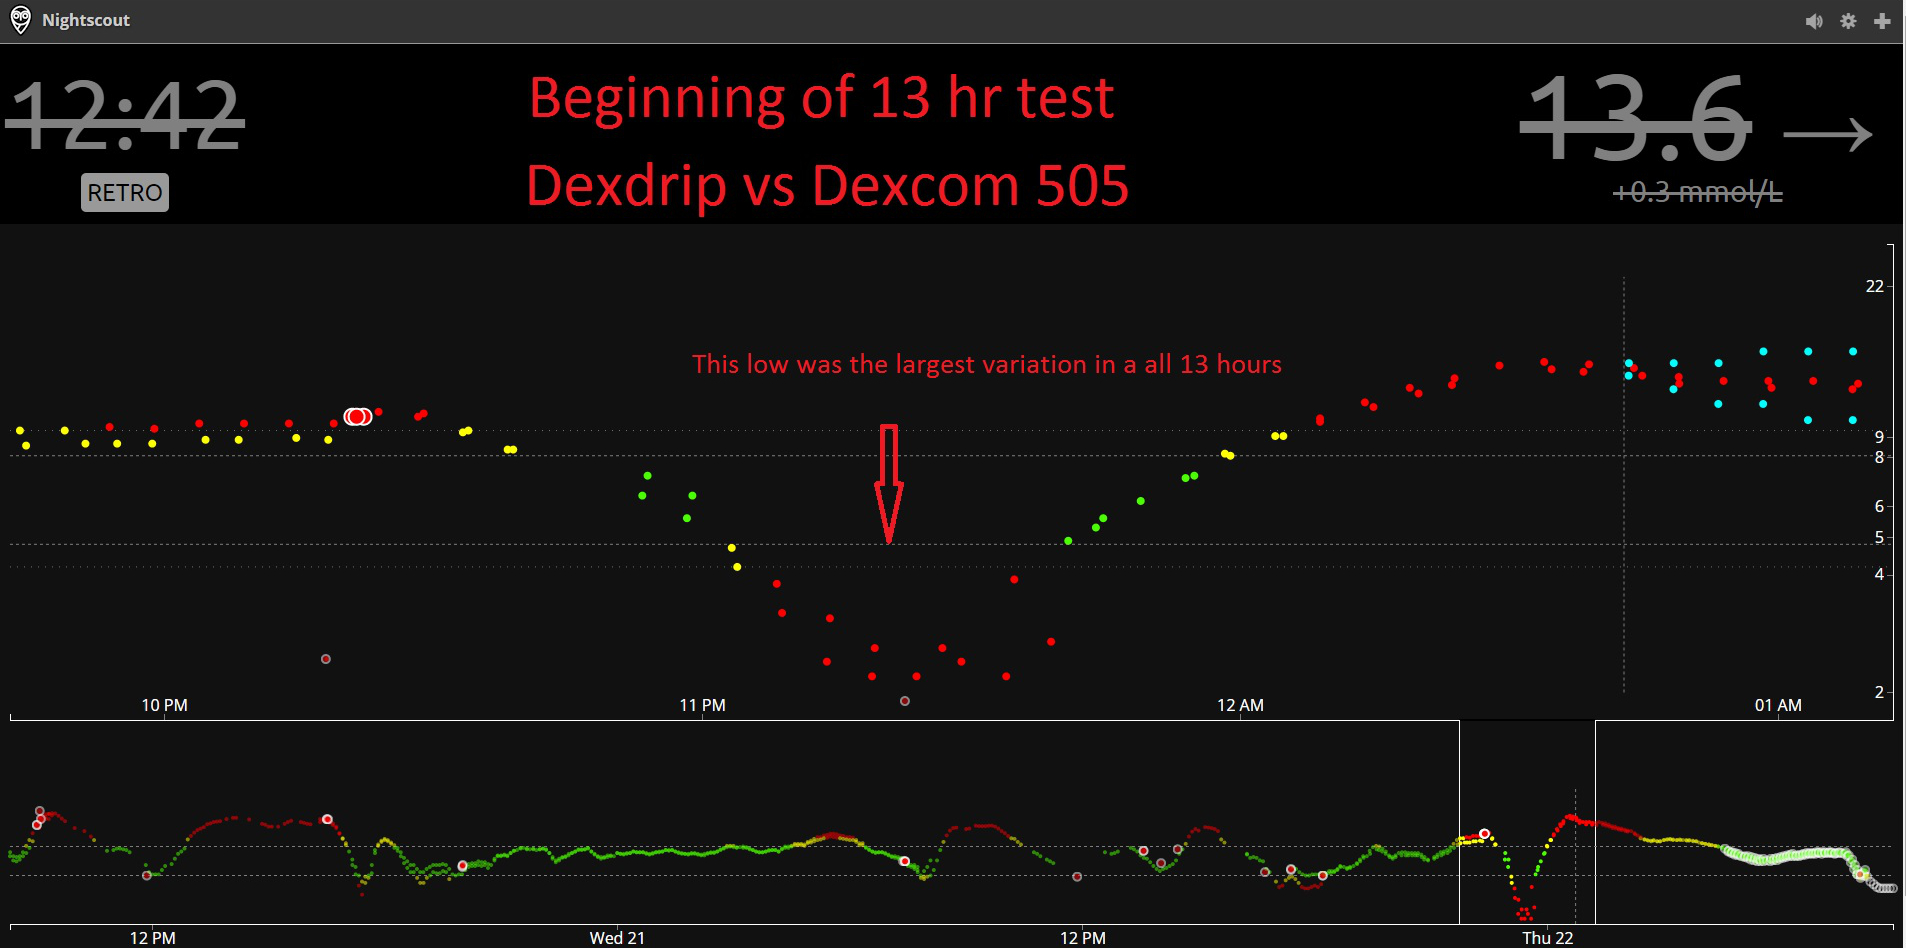
At the end of an overnight test
Although there hasn’t been a calibration for 10 hours values are almost exactly the same, maximum out is 0.4mmol/l (7 mg/dl).
Although there hasn’t been a calibration for 10 hours values are almost exactly the same, maximum out is 0.4mmol/l (7 mg/dl).
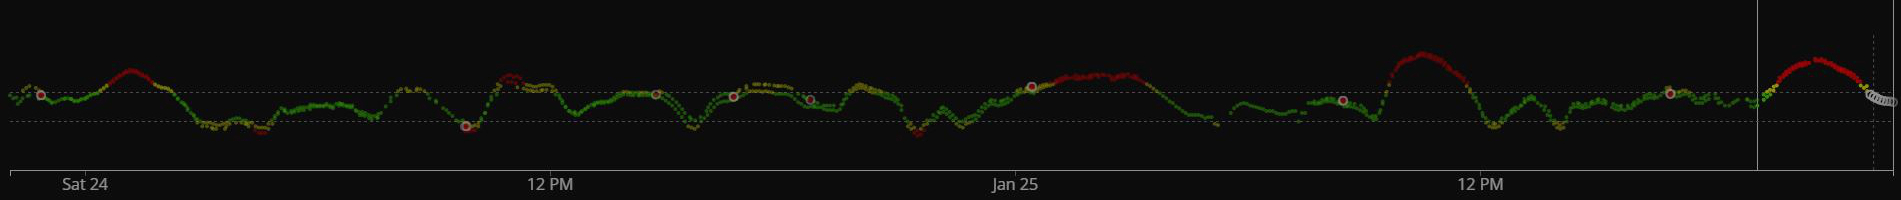
A 48 hour trace
The CGM trace below shows a trace over 48 hours – you can scroll left/right.
At times you can see there’s a difference, potentially 1 mmol/l out at maximum point.
Upper line is at 8mmol/l (144mg/dl), lower line is at 4mmol/l (72mg/dl). Red dot indicates a calibration.
Click here if you want to view the full image
Distance test
Here’s a test placing the xDrip at different distances away from the transmitter, showing that at 25 feet it ability to receive data is impaired, yet at 10 feet it is perfect.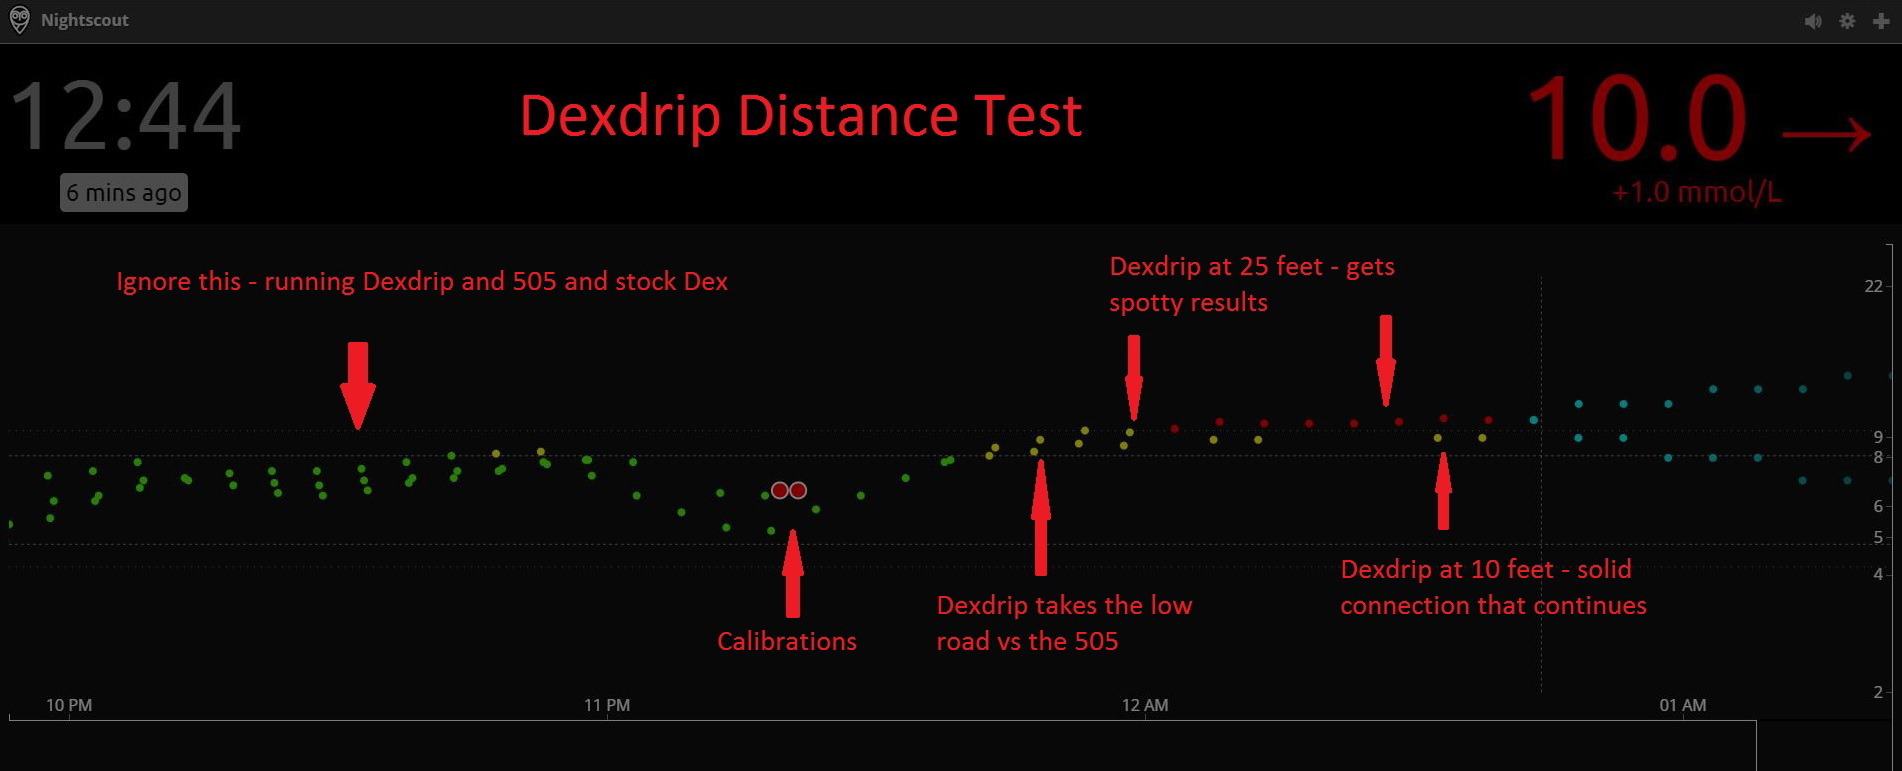
Here’s a test placing the xDrip at different distances away from the transmitter, showing that at 25 feet it ability to receive data is impaired, yet at 10 feet it is perfect.
Interested in further posts about this subject? Why not like this blog’s Facebook page and get notified of updates, or click ‘Follow’ using the button at the bottom-right of this page.
PLEASE READ THIS ADVISORY
a) Never make a medical decision based on a reading from any CGM device, whether certified (eg Dexcom) or not (eg xDrip). Always perform a fingerstick blood glucose check first.
b) xDrip is a DIY product, decide for yourself if you wish to use it. Build it, test it, test it again and use (if you want to) in conjunction with a certified receiver.
c) The fact that it is working for us does not mean it’s right for you.
d) Never build a xDrip for anyone else and never sell one.
e) The blogs are provided for information only. We are not endorsing it for use by others, nor promoting it, just merely publishing our information as well as answering questions from previous blog articles.
Here is some additional data that may or may not be helpful to you and your readers. As I understand it, the sensor broadcasts a raw signal (and possibly sensor noise values?) that both the Dexcom and xDrip pick up. xDrip uses the raw signal value which it puts through a slope intercept (y=mx+b) equation to calibrate, but no other math or formulas are used to derive more accurate readings. What I’m not sure about is how the signal noise is determined. The 505 algorithm smooths out data when there is noise and overall is more reliable than when not being used, but not always. Sometimes the 505 smooths out sudden drops or raises that shouldn’t be smoothed and they take 5-10 additional minutes to show up as compared to when using slope-intercept alone. I think some people are critical of the Dexcom algorithms for that reason. They prefer observing the “noise” so they can potentially react to sudden drops more quickly. However, the addition of xDrip-experimental being able to read from the Dexcom Share2 receivers solves this problem entirely. xDrip can connect to the Dex Share and upload both the raw and the filtered value to NightScout, so you can have the best of both worlds.
Also, I just emailed with Stephen Black (xDrip author) and he wrote me, “And as for the wixel based code, we have filtered data as well (we weren’t uploading it but will be soon, the code is there, just not persisting it at the moment because we weren’t using it) We also consider a reading to be noisy if its more than 30% off from its ‘filtered’ value, It seems to be a pretty good read but we are still playing with that percentage, it will probably wind up being past reading slope dependent as well but yeah!”